Performance curve (circulation simulation)
The Characteristic Curve window displays the characteristic curves of a selected component in the drawingin the document.
Static balancing valves
For balancing valves, the Characteristic Curve window is divided into two tabs. The ... button is displayed on both tabs. Clicking ... takes you to the valve settings for the selected valve.
-
Characteristic curve
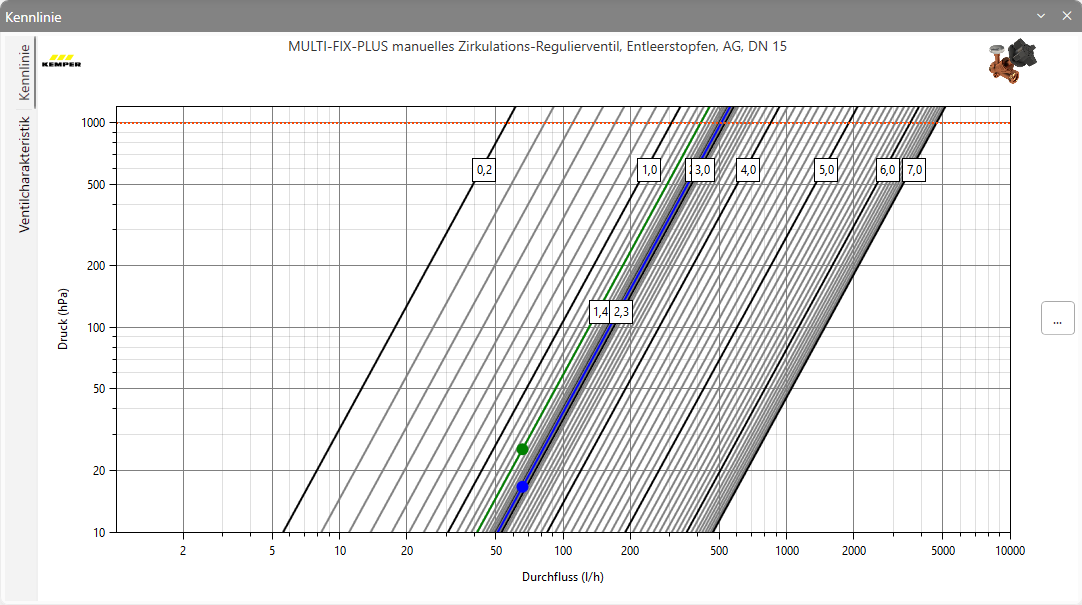
If you have selected a static balancing valve, the maximum pressure loss from the product data is displayed as a red boundary line. In the valve settings, you can configure the adjustment steps based on the product data. The actual operating point is then displayed in blue and the setpoint operating point in green in the Characteristic curve window .
-
Valve characteristic
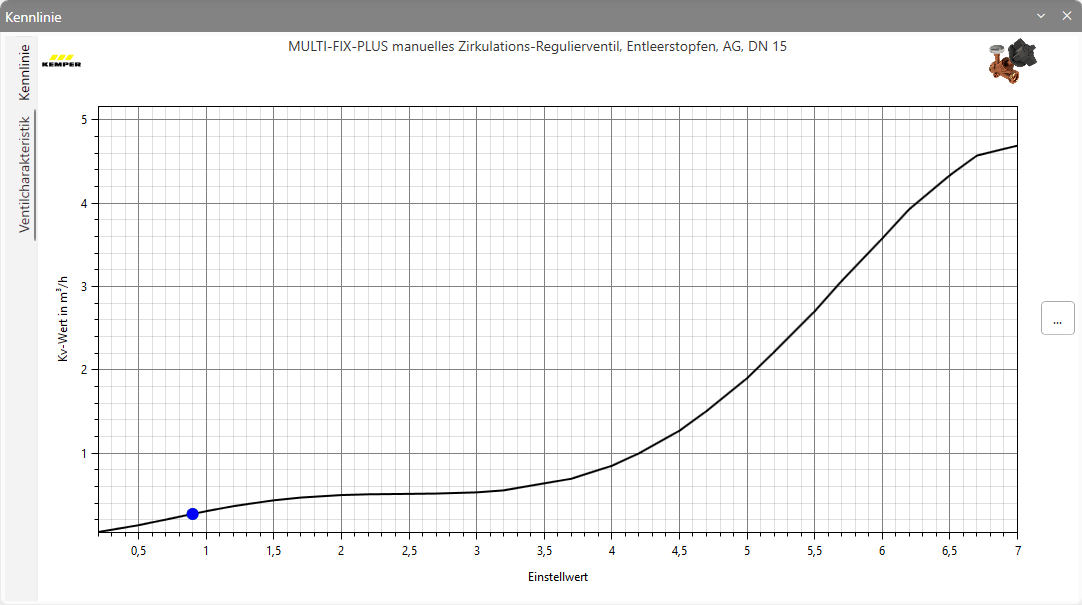
The valve characteristic curve displays the valve characteristic curve with the operating point.
Thermal control valves Balancing valves
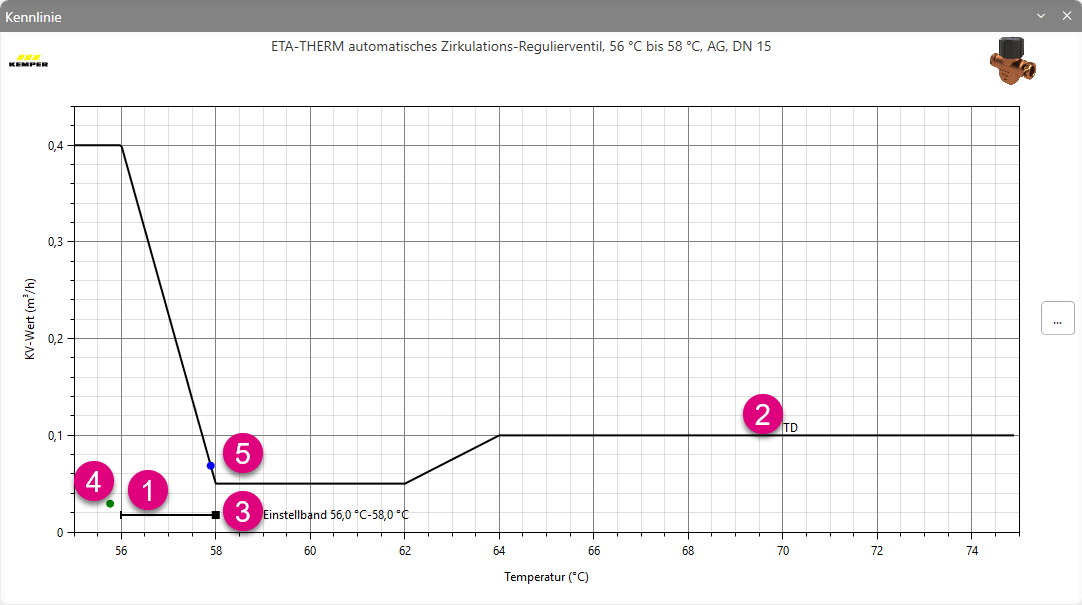
If you have selected a balancing valve, the adjustment band (1) and the characteristic curve extension for thermal disinfection (TD) (2) are displayed. The adjustment band describes the control range of the valve. A temperature is preset by the manufacturer. This is marked by the black square (3). Once the hydraulic balancing has been carried out, the calculated operating point (4), marked in green, and the determined operating point (5), shown in blue following the simulation, are displayed.
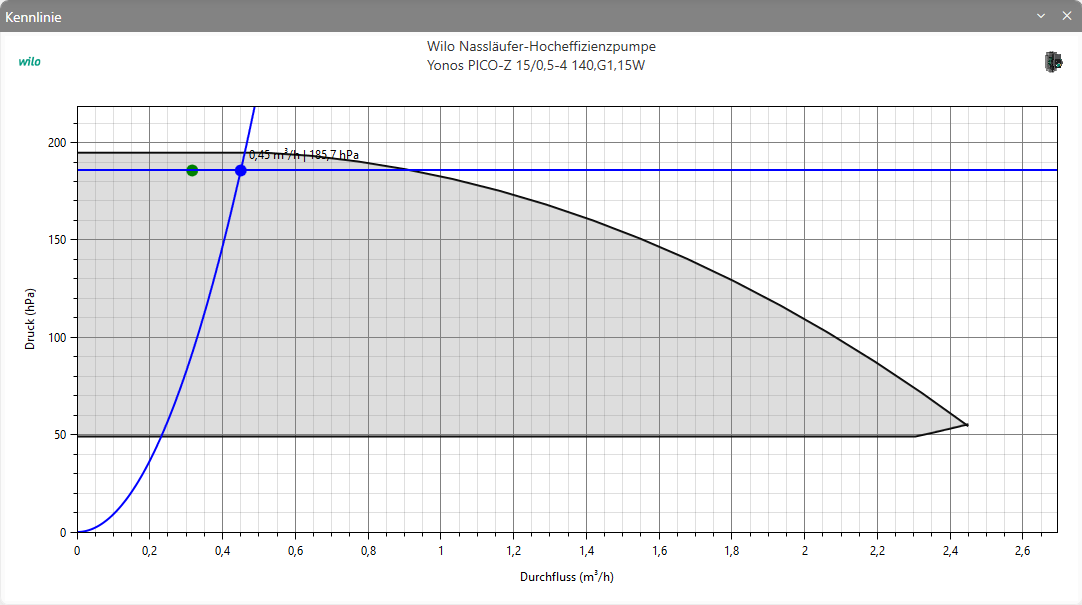
Circulation pump
The green operating point indicates the calculated operating point from the calculation. The blue operating point represents the operating point following the simulation.