
Pressure Profile (Circulation Simulation)
The Pressure Profile window displays the pressure profile in the currently selected flow path.
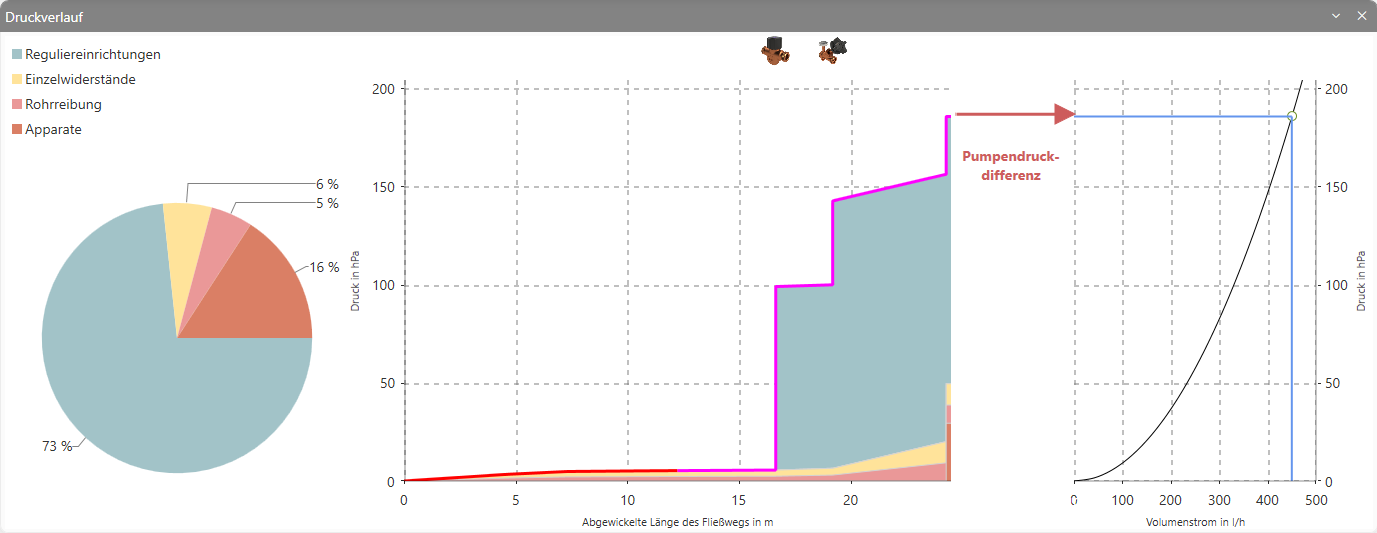
The pressure profile display illustrates the individual pressure losses in the selected circulation flow path in various ways. The percentage distribution is shown in a pie chart. The unfolded pipe length, together with the corresponding pressure losses of the fittings and the pipework, is displayed in the centre of the Pressure Profile window. If the mouse pointer is moved over a section of the hatched area, the individual pressure loss values are displayed as a list. The graphical representation of the pipe network characteristic curve is shown in the diagram on the right-hand side.