
Performance curves
New characteristic curve displays
The following characteristic curves have been revised to ensure even greater transparency in the calculation of pressure loss. The operating points are now uniformly shown in blue and are labelled on the diagram. Furthermore, additional limit lines and information lines have been included. In the results documentation, the display has been consistently updated to reflect the new characteristic curves.
- The characteristic curve for components with a Kv value also displays a guide line at a flow velocity of 2.5 m/s.
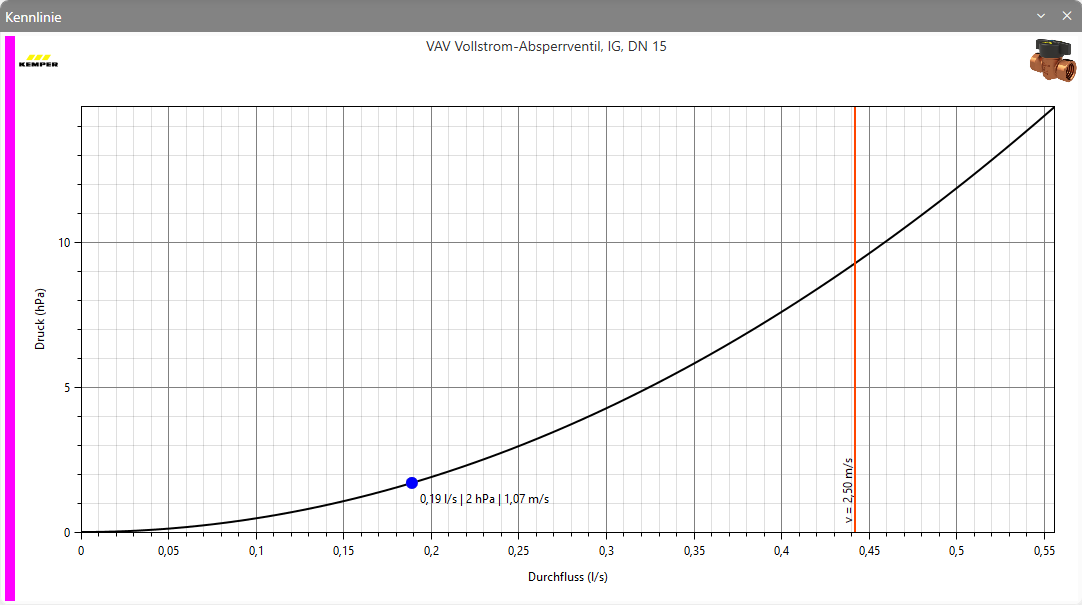
- Components with an extended characteristic curve, based on reference points specified in the technical product data, are supported. An additional guide line is displayed at a flow velocity of 2.5 m/s.
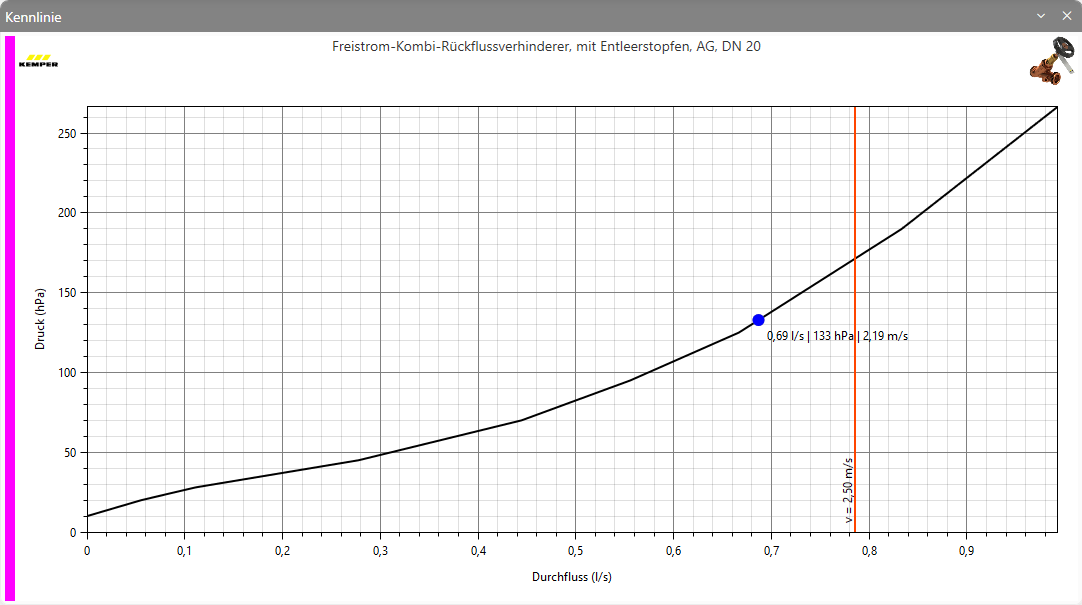
- The characteristic curve for pressure regulators displays a green auxiliary line at the maximum flow velocity for pressure regulators of 2.0 m/s and a red boundary line for the minimum flow rate in accordance with the product data.
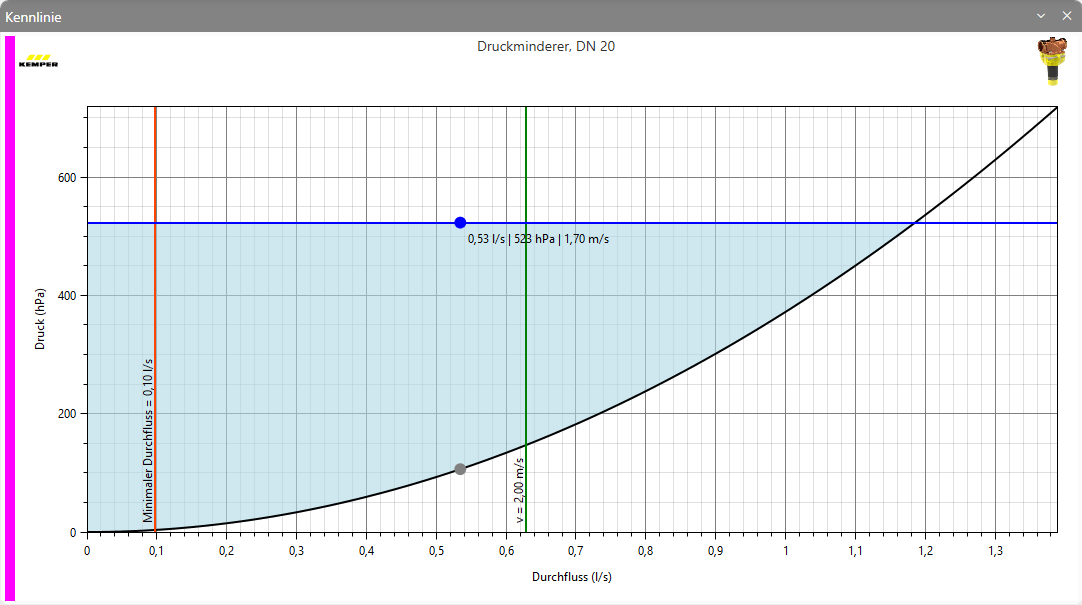
- The performance curve for tap-off valves displays a red information line at the minimum flow pressure, as well as the operating points for the ‘ Resting pressure ’, the ‘VR ’ value and the flow pressure.
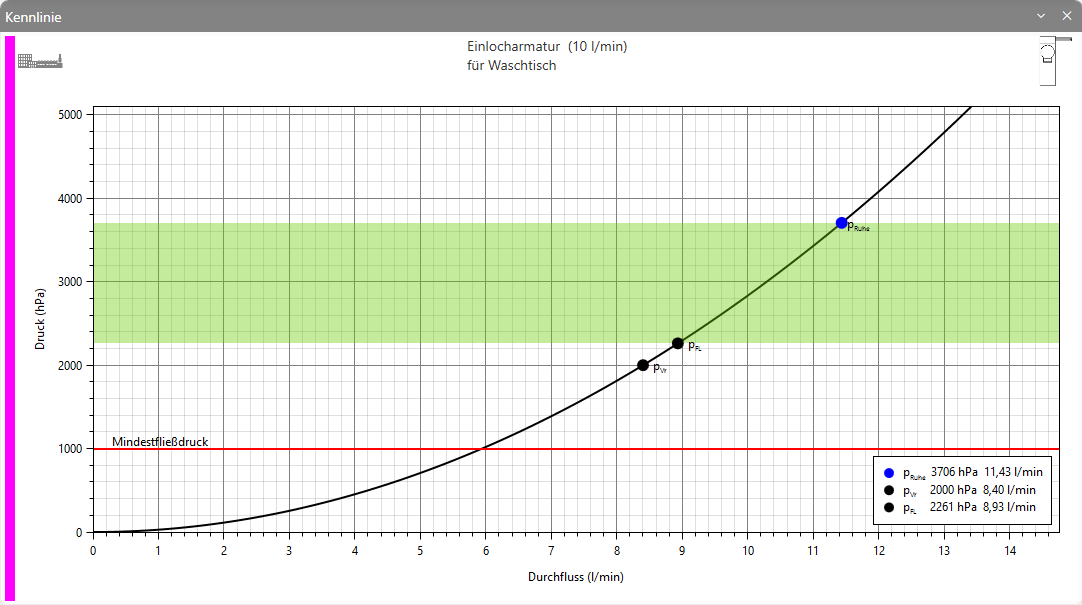
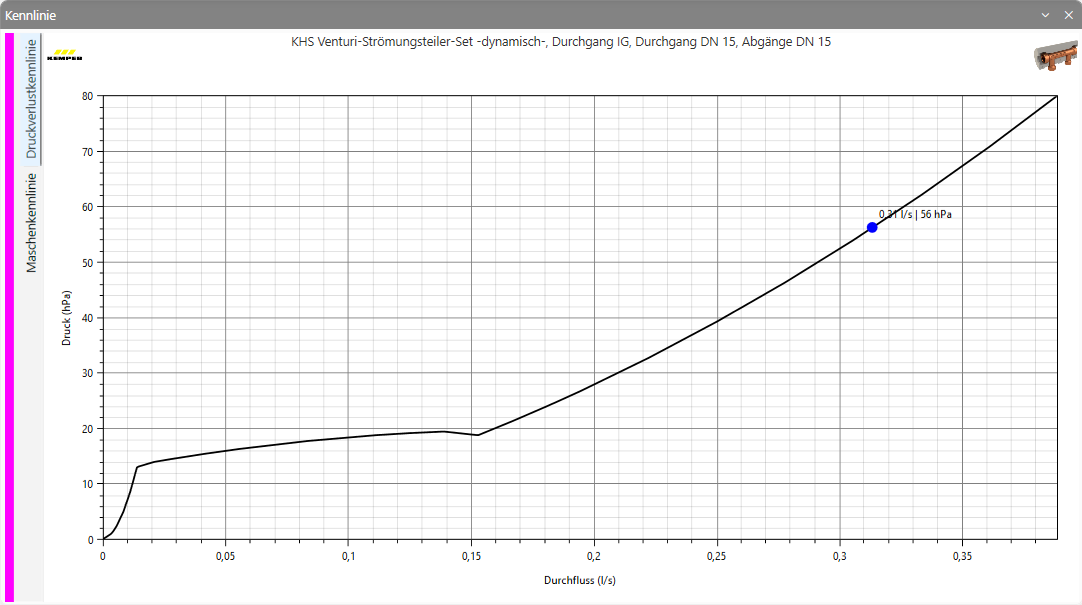
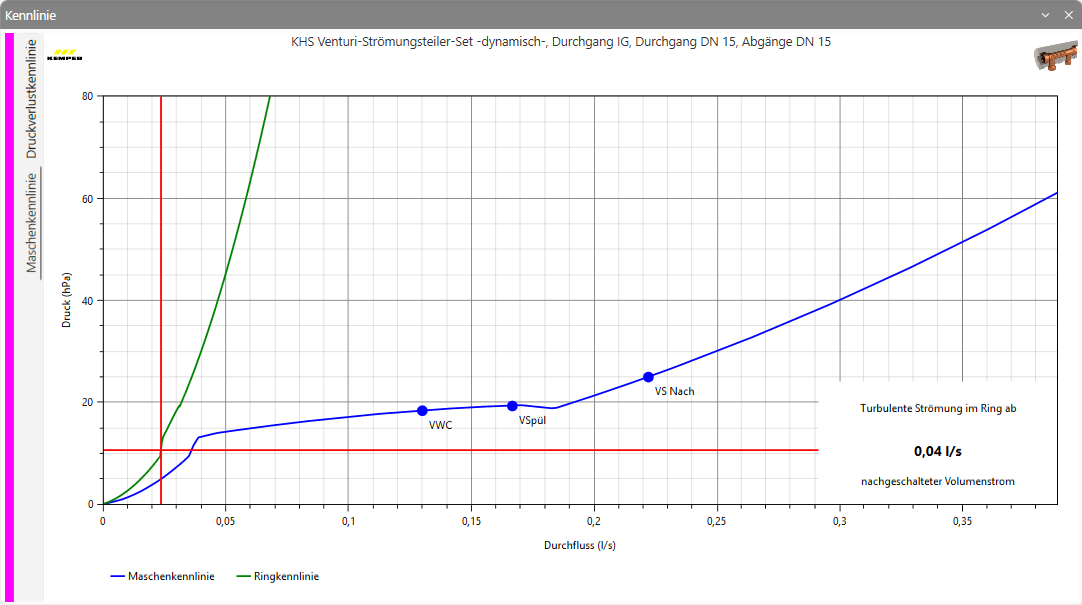
- The characteristic curves for the flow divider in the case of a tap-off are split across two tabs.
- Pressure loss characteristic curveThe pressure loss characteristic curve shows the pressure loss of the flow divider, including the operating point at the peak volume flow VS.
- Mesh characteristic curveThe blue characteristic curve shows the orifice characteristic curve with the pressure loss of the flow divider and the pressure loss from the ring. The blue operating points indicate the flow rate of the downstream consumer, the purge flow rate VSpül of a downstream purge device and the flow rate VSNach of the downstream consumers. The green characteristic curve shows the ring characteristic curve. The red boundary lines indicate the point at which turbulent flow begins. Below the red boundary lines, the ring is traversed by laminar flow.
- Pressure loss characteristic curve
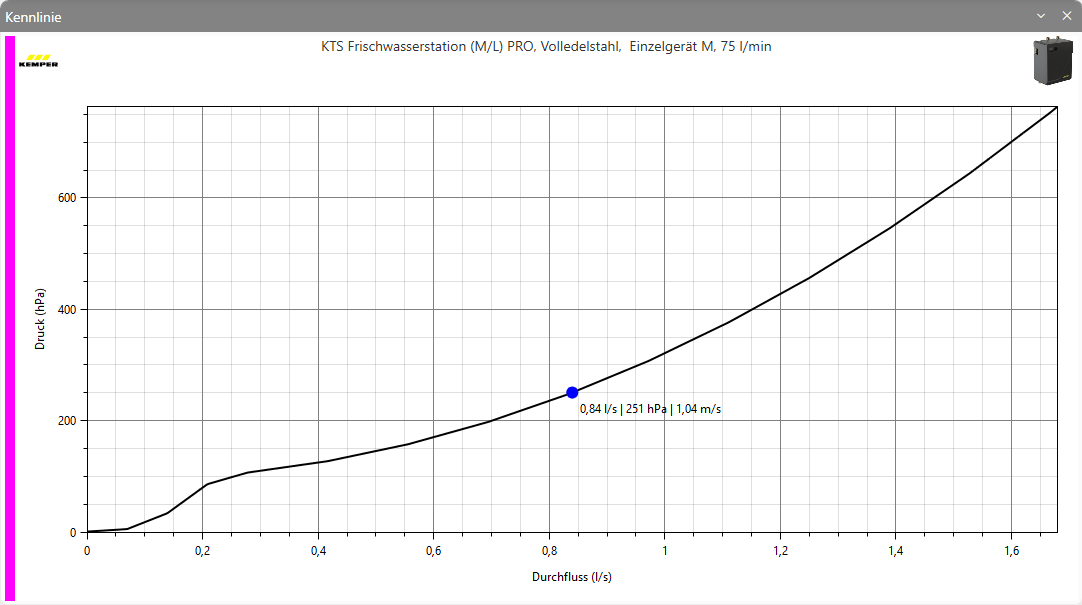
- The characteristic curve for the KTS fresh water station shows the corresponding flow velocity at the operating point.
- The characteristic curves for static circulation control valves are divided across two tabs.
- Performance curveThe characteristic curve, with a logarithmic axis scale, for static circulation control valves shows the characteristic curve for the respective valve settings. In addition, the maximum pressure drop from the product data is displayed as a red boundary line.
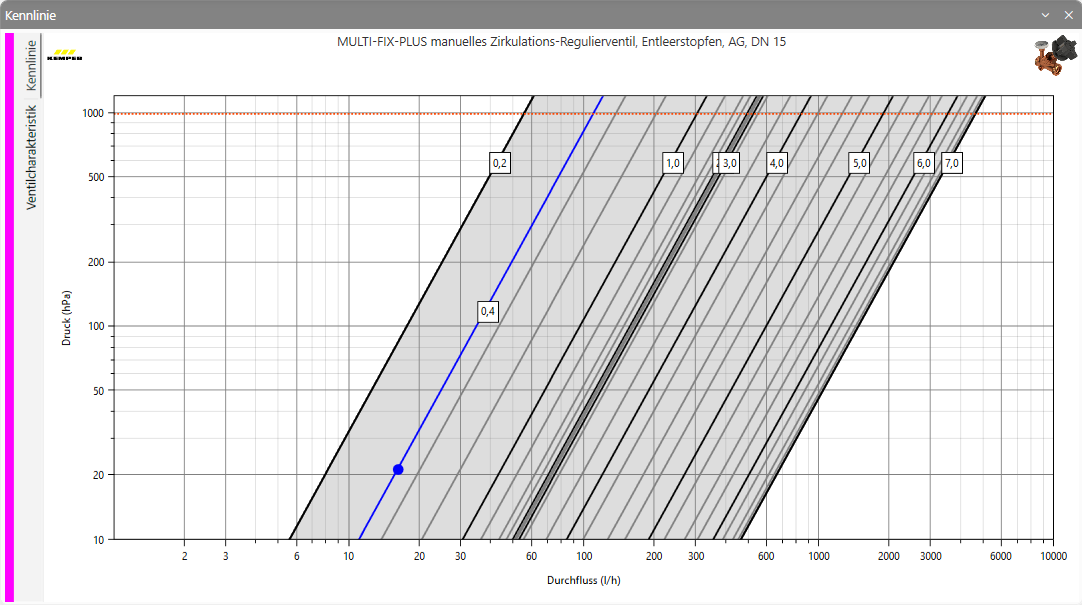
In the simulation, the adjustment steps can be set using the product data. The actual operating point is then displayed in blue and the setpoint operating point in green.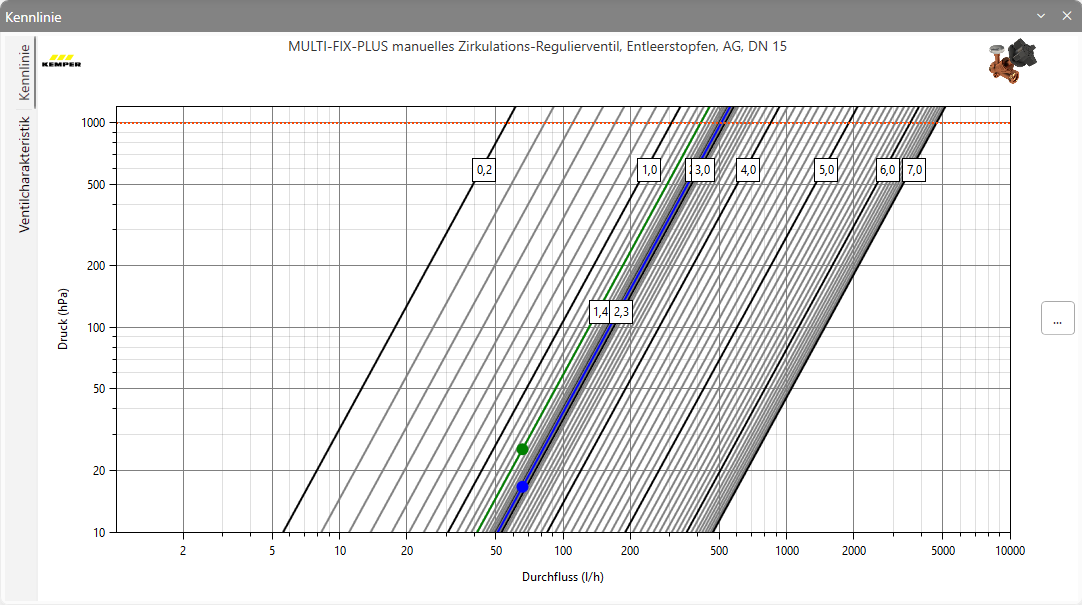
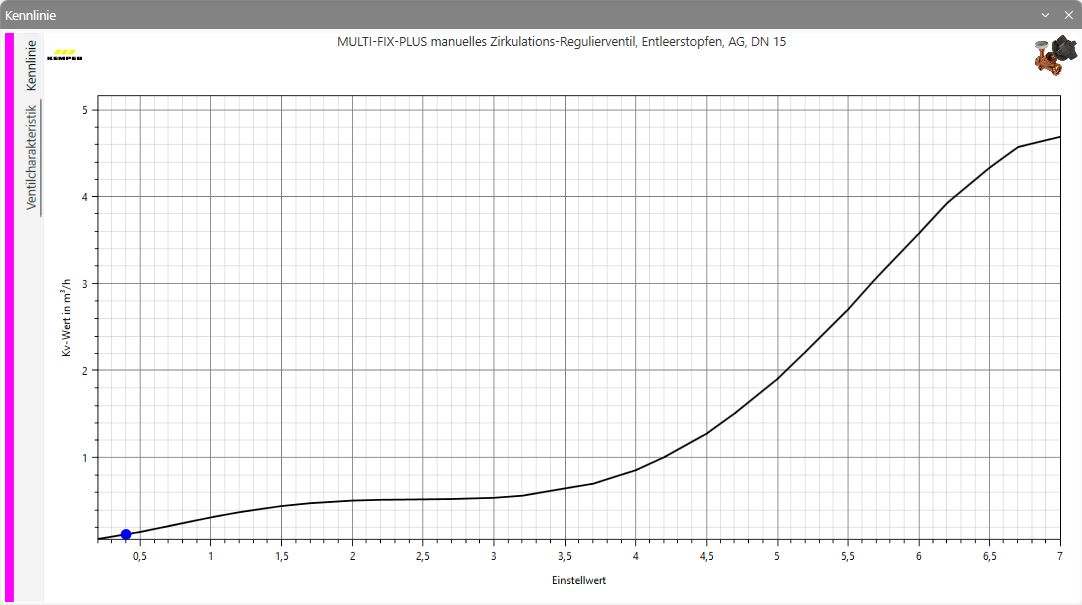
- Valve characteristicThe valve characteristic curve displays the valve characteristic curve with the operating point .
- Performance curve
- The characteristic curves for static control valves are split across two tabs.
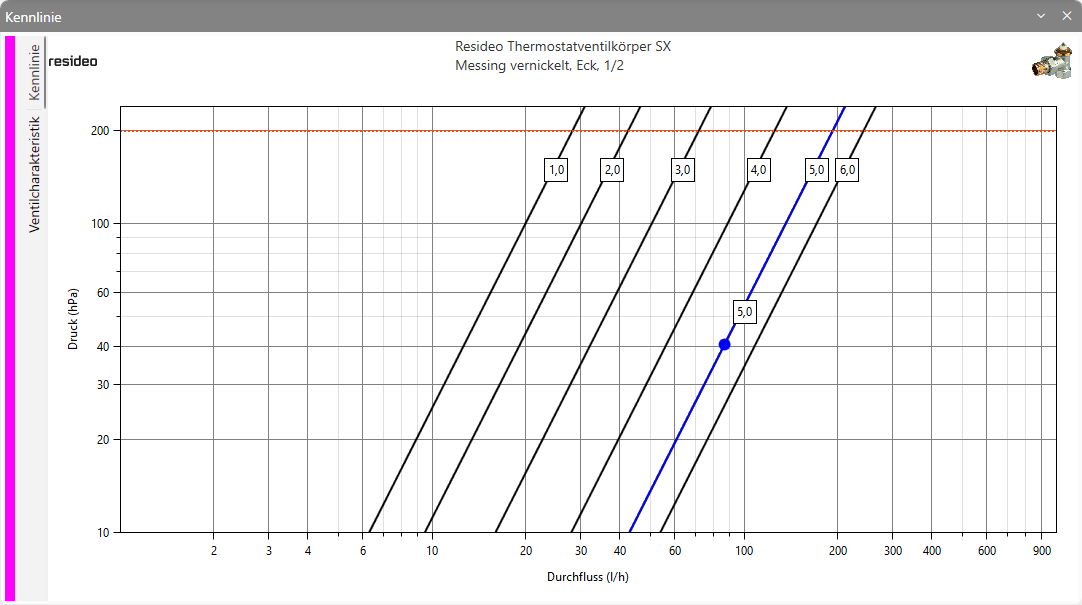
- Characteristic curveThe characteristic curve, with a logarithmic axis scale, for static control valves displays the characteristic curve for the respective valve settings. In addition, the maximum pressure drop derived from the product data is shown as a red boundary line.
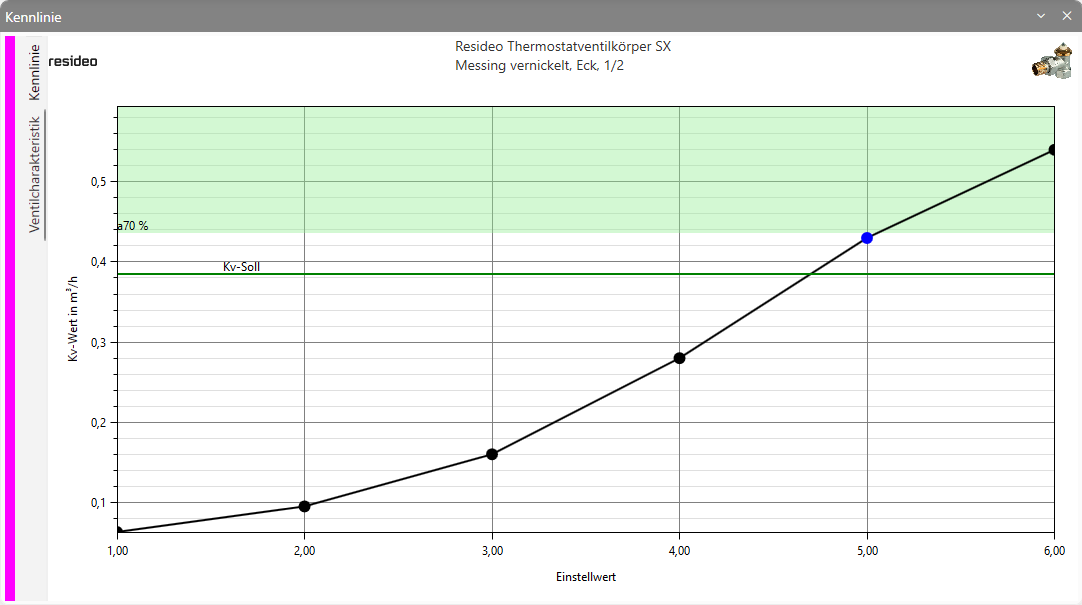
- Valve characteristicsThe valve characteristic curve displays the valve characteristic curve with the valve authority band and the Kv setpoint.
- The characteristic curve for flow controllers also displays the setpoints with the blue operating point.
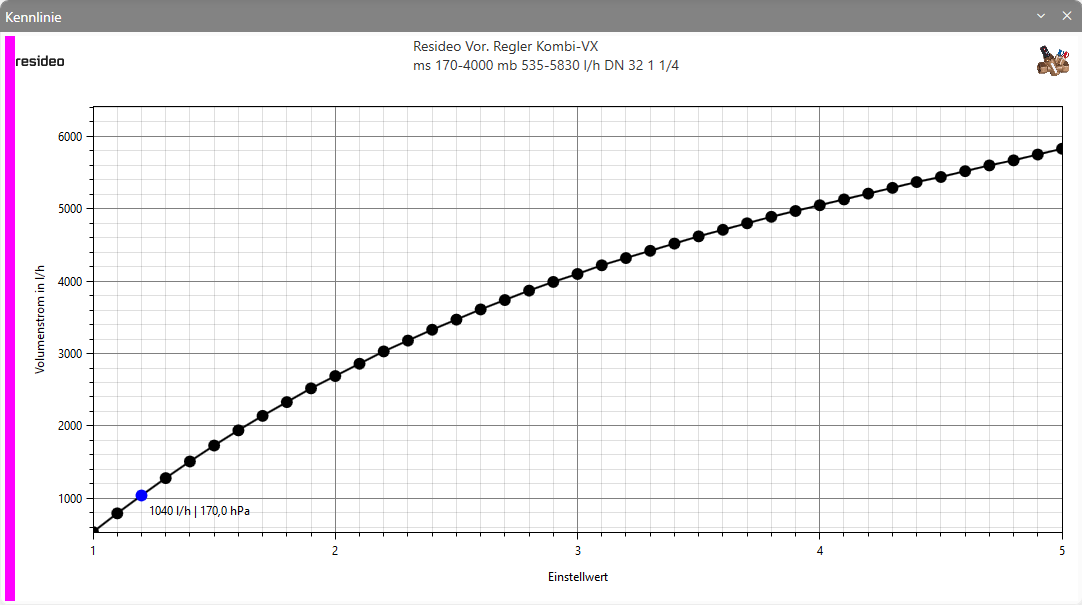
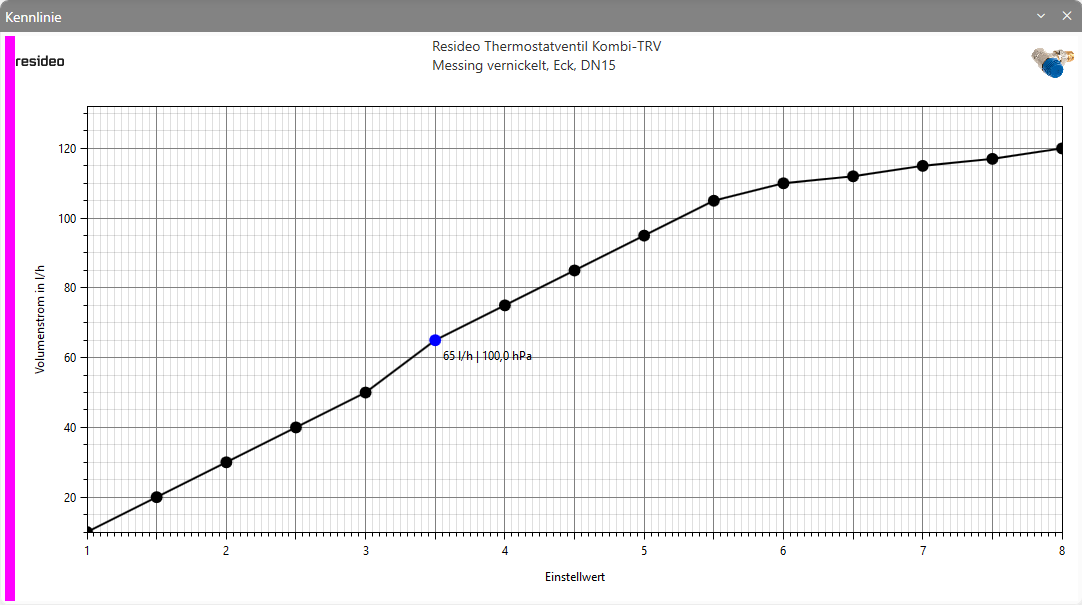
- The characteristic curve for thermostatic valves with flow controllers also displays the setpoints with the blue operating point.
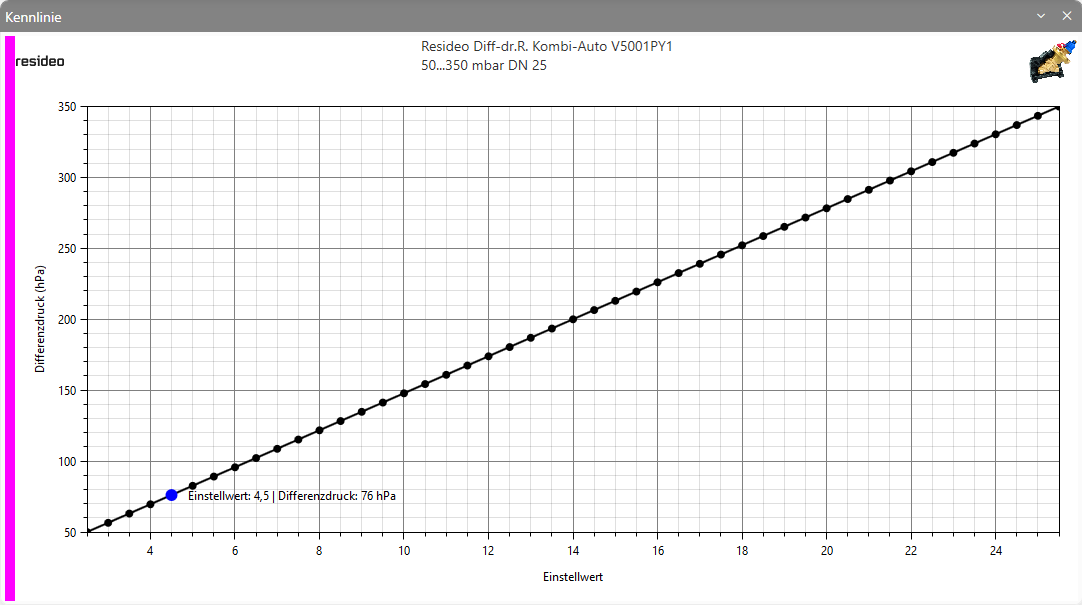
- The characteristic curve for differential pressure controllers also shows the setpoints with the blue operating point.
- Characteristic curve