
Peak flows
The Peak flows window provides brief information on the volume flows in the selected section.
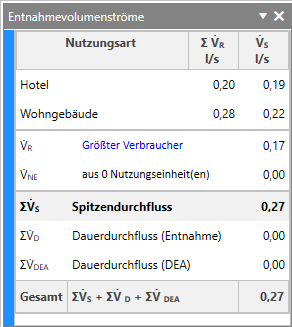
| Name of the component | Explanation of the component | Physical unit |
|---|---|---|
| Type of utilisation | Displays the utilisation types of the selected section including their calculation and peak flow rate. | |
| VR | Indicates the calculation volume flow. Note: Clicking on Largest consumer marks the consumer with the largest calculated volume flow in the drawing. |
[l/s] |
| VNE | Indicates the sum of the two largest calculation volume flows of the utilisation unit. | [l/s] |
| ΣVS | Indicates the sum of the peak flow rates. The displayed peak flow rate already takes into account the proportion set in the design options for the calculation flow rate of other types of utilisation. Note: When you move the mouse over the V columnS l/s, detailed information on the distribution of the individual peak flow rates is displayed. |
[l/s] |
| ΣVD | Indicates the volume flow of the continuous flow (tapping points). | [l/s] |
| ΣVDEA | Specifies the continuous flow rate (pressure booster system). | [l/s] |
| Total | This value results from: ΣVS+ΣVD+ΣVDEA | [l/s] |
You can find more information on our YouTube channel.
