
Temperatures during stagnation
The Temperatures during st agnation window shows the temperature development in the cold water pipe (PWC) and the hot water pipe (PWH) during stagnation depending on the ambient temperature.
A possible temperature curve for stagnation in a cold water pipe could be as follows:
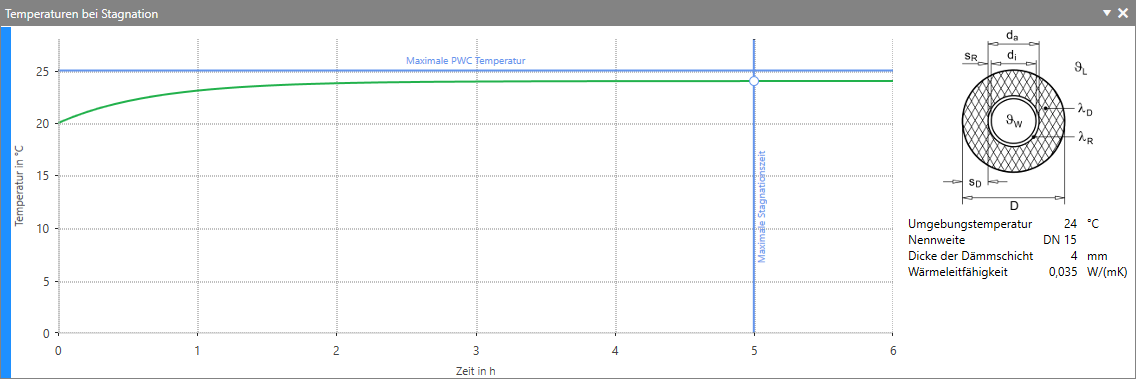
The diagram shows when the stagnating water has reached the maximum permissible temperature and what temperature the water has after the maximum stagnation time.
The diagram shows when the stagnating water has reached the maximum permissible temperature and what temperature the water has after the maximum stagnation time.
A possible temperature curve for stagnation in a hot water pipe could be as follows:
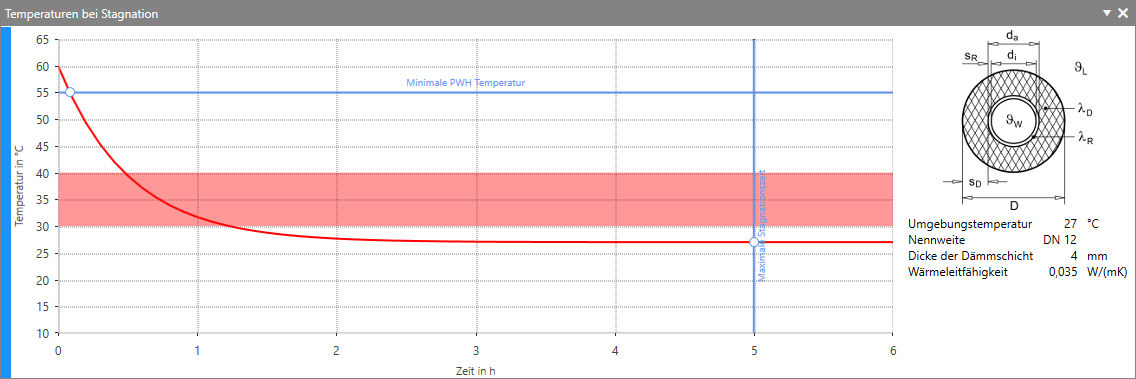
The diagram shows when the stagnant water in the PWH pipe has reached the minimum permissible temperature and the temperature of the water after the maximum stagnation time has been reached. The area marked in red between 30 °C and 40 °C indicates the critical temperature range with a particularly high risk of contamination. This critical temperature range provides optimum conditions for the growth of microorganisms and must therefore be strictly avoided.
The diagram shows when the stagnant water in the PWH pipe has reached the minimum permissible temperature and the temperature of the water after the maximum stagnation time has been reached. The area marked in red between 30 °C and 40 °C indicates the critical temperature range with a particularly high risk of contamination. This critical temperature range provides optimum conditions for the growth of microorganisms and must therefore be strictly avoided.
Note:
You can adjust the maximum stagnation time in
Note:
You can adjust the maximum stagnation time in .
You can find more information on our YouTube channel.
